Introduction
As we have seen in previous lessons, continuous records of discharge at gaging stations are computed by applying a discharge rating to stage data. The discharge rating curve transforms the stage data to a continuous record of stream discharge. The rating curve is also used to transform forecasted flow hydrographs into stage hydrographs. The discharge rating curve may be simple or complex depending on the river reach and flow regime. The objective of this lesson is to examine simple stage discharge concepts where the discharge is only a function of stage. A typical simple stage discharge relationship is shown in Figure 6.1.
 |
| Figure 6.1. Rating curve for Mad River near Arcata. |
Discharge models, also known as rating curves, stage ratings or stage-discharge relations are typically developed empirically from periodic measurements of stage and discharge. Discharge is computed current meter data. These data are plotted versus the concurrent stage to define the rating curve for the stream. For new gaging stations, many discharge measurements are needed to develop the stage discharge relation throughout the entire range of streamflow data.
Generally periodic measurements are needed to validate the underlying stage-discharge relationship and to track changes or shifts in the rating curve. The USGS recommends a minimum of 10 discharge measurements per year, unless it has been demonstrated that the stage discharge relation is invariant in time. Of extreme importance is the capability of the stage-discharge relation to be applicable for flood or extreme flow conditions and for periods when the rating shifts as a result of ice formation.
Discharge measurements are usually lacking in the definition of the upper end of the rating curve. As a result, the extrapolation of the lower parts of the rating curve is used to "approximate" the higher stages of the river. The extrapolation of these data are subject to serious error that can have significant implications for flood planning and the attendant loss in human life and property. The extrapolation issues can be circumvented if indirect methods of determining unmeasured peak discharge are used. Without such data, some of the uncertainty can be reduced by estimating discharge associated with these stage values, which will be addressed in Lesson 7.
We begin with a review of stage-discharge controls.
Stage-Discharge Controls
As we saw in Lesson 3, the stage discharge relation is controlled by a station control, a section or reach of channel downstream from the gage. The control may be natural or man made. A section control is usually effective only at low discharges. At medium and high discharges, section controls are completely submerged, and the relationship between stage and discharge is governed by channel control. Channel control is the set of all physical features of the channel that dictate the river stage at a given point for a given flow rate. The features include size, slope, roughness, alignment, constrictions and expansions, and the channel shape. The channel reach that functions as a control may lengthen as the discharge increases, introducing new features in the stage discharge relationship.
The development of the rating curve when there is more than one control effective and when data are limited, requires judgment in both interpolation and extrapolation of the data. This situation is partially aggravated when the controls are not permanent; the various discharge measurements are then representative of changes in the positioning of the segments of the rating curve.
Development of Rating Curves
 |
| Figure 6.2. Hand drawn rating curve. |
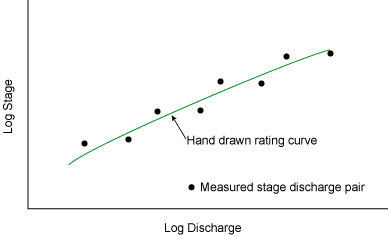
The discharge and stage measurements are plotted on either rectangular (arithmetic) coordinate or logarithmic plotting paper. Discharge is plotted as the abscissa; gage height or stage, the ordinate. The discharge measurements are numbered consecutively in chronological order to facilitate the identification of time trends.
Hand drawn curves are typically used to fit the stage and discharge measurements to produce a rating curve. Considerable judgement is normally exercised to decide on the best curve. For example, knowledge of the river is applied and consideration is given to such factors as the quality and magnitude of each measurement. In the simplest case, when a single control exists, these curves would be practically straight lines on log scales. The case of compound controls will be discussed later in the lesson. A hand drawn curve is shown in Figure 6.2. Each point represents a stage discharge pair.
 |
| Figure 6.3. Hand drawn rating curve with 5 values extracted from the curve to define the rating. |
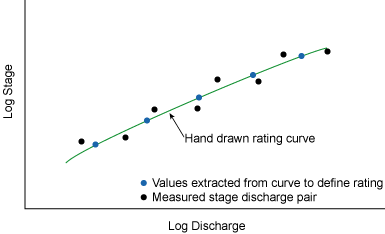
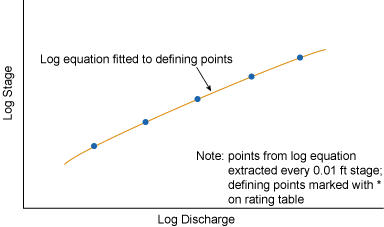
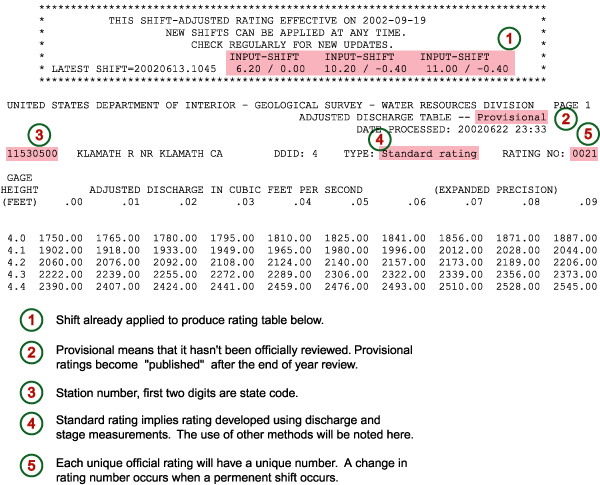
After the hand drawn curve is established, representative points that lie exactly on the curve are extracted. These points define the rating curve. The number of points extracted can range from two for a very simple channel with a single control to 20 points or more for channels with many controls. Figure 6.3 illustrates how these points lie on the curve in contrast to the actual stage- discharge measurements. Once the defining points have been selected, one or more logarithmic equations are used to mathematically fit the points. It is from these logarithmic equations that the actual rating table values are derived, usually at increments of 0.01 foot of stage as shown in Figure 6.4. Figure 6.5 contains an example rating table that would result from the above process, with explanations of the header information. Note that an asterisk by a value indicates that it coincides with an actual stage- discharge measurement.
 |
| Figure 6.4. Rating curve with log equation through defining points. |
| Table 6.1. Rating table for Klamath River, near Klamath, CA. |
 |
Interpreting the Rating Curve
 |
| Figure 6.5. Rating curve for Klamath River, near Klamath, CA with arithmetic and logarithmic scales. |
Paired stage and discharge data are commonly plotted on logarithmic paper (log scale for both the ordinate and abscissa) since this scaling tends to produce a nearly linear (or at least piece-wise linear) fit to the observed data. Assuming the rating "curve" is nearly a straight line in situations with compound controls, changes in the slope of log rating "curve" identify the range in stage over which the individual control is effective. The "linearized" rating line also makes extrapolation or interpolation comparatively easy compared to using the data on an arithmetic or rectangular scale. Figure 6.5 shows how a rating curve would look under logarithmic versus rectangular coordinates. The benefit of using rectangular-coordinate paper for rating analysis is that trends and changes in the low flow portion of the curve are more apparent and that zero flow conditions can be identified. Zero flow cannot be described in the log scale. For flood forecasting, however, logarithmic plotting is preferable because of its ability to identify control changes. This is very useful during real-time flood monitoring.
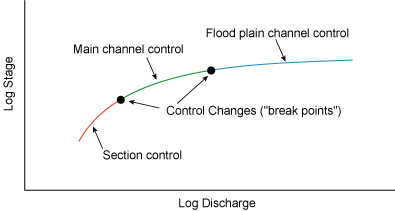 |
| Figure 6.6. Rating curve for a stream with section, channel and flood plain controls. |
Figure 6.6 shows a rating curve with three distinct sections within which the segments can be described as nearly linear. The point at which the slope of the curve changes coincides with the stage at which one control becomes submerged and the next control becomes effective. This transition point should be considered when observed data is being monitored during significant river rises. For example, consider the case where a river stage is increasing at a dangerous rate, and it is occurring at a stage that is near the top of the portion of the rating under the main channel section control. It can be concluded from the rating curve that the rate of rise will likely moderate even if the rain and flow rate remain constant. From Figure 6.6, it can be seen that significant increases in flow are required for only moderate increases in stage once the stage reaches a level that is under the influence of the flood plain channel control portion of the rating. Figure 6.7 relates this concept to the channel characteristics. Once the flow leaves the main channel, the horizontal component of the cross sectional area increases dramatically compared to the main channel. Correspondingly, the vertical component (or stage) of the cross sectional area does not increase significantly for increases in flow. For these reasons, ratings plotted logarithmically provide useful insight into the behavior of a river reach at moderate to high flow.
 |
| Figure 6.7. Channel cross section showing section, channel, and flood plain control stage heights. |
Rating Curves for Artificial Section Controls
The rationale for addressing rating curves for artificial controls is that these controls are the basis of stage discharge relationships for natural controls. Thin plate or sharp-crested weirs, broad-crested weirs, and flumes are the most common artificial controls.
The crest of a thin plate weir is susceptible to damage from floating debris, so they are generally only used in small, clear-flowing streams. Thin plate weirs are rarely used for gaging flow at stations utilized in flood forecasting, and the rating curves for these weirs are not presented here. Readers interested in the details of the stage discharge relationships for thin plate weirs are directed to the supplemental materials section associated with these lessons.
Broad crested weirs are used in larger streams. Both thin plate and broad-crested weirs provide high accuracy although regular maintenance is required. In contrast, flumes are preferable for small streams with significant sediment and debris loads; they are also where the head loss associated with thin plate weirs is unacceptable. Many types of flumes can be used under submergence conditions; this permits them to operate with a even smaller head loss and a consequent loss of accuracy. While the use of weirs is common for gaging station controls, flumes are rarely used by the USGS as a control for a discharge gaging station.
Broad Crested Weirs
The most common artificial control built in natural channels is the broad crested or flat crested weir. These types of weirs have the strength and durability to withstand debris damage. They are often built with a gently sloping upstream apron (1 vertical to 5 horizontal) to minimize and impedance to flow and sediment carried over the weir. The weirs are usually built low so that they can act low water controls; they are submerged at intermediate and high stages.
There are a multitude of crest shapes for broad crested weirs. The interested reader is referred to King and Brater (1963) and US Bureau of Reclamation (1997) for additional information.
Flat Crested Rectangular Weir
The most basic type of broad crested weir is the rectangular in cross section weir (Figure 6.8). The discharge equation can be expressed as
Q = CL(h + hv)1.5 6.1
where Q is the discharge, C is a discharge coefficient, b is the width, h is the head, and hr is the head attributable to the approach velocity. The discharge coefficient, C, and hv both increase with stage as shown in Figure 6.8.
The rating curve when plotted on log paper with again be a straight line, except for extremely low stages. The equation can be represented as
Q = p(G - e)N 6.2
where the exponent is the slope of the curve. The exponent will exceed 1.5 since the velocity head and the weir coefficient increase with stage.
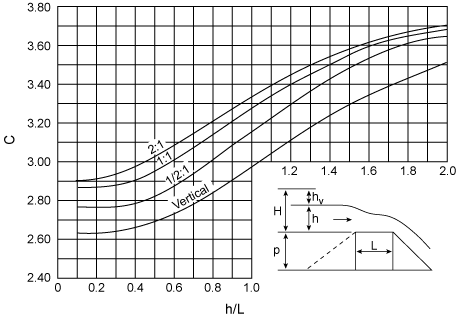 |
| Figure 6.8. Rectangular flat crested weir. |
Trenton Type Control
The Trenton type control is a concrete weir frequently used in the United States. The cross section of the crest is shown in Figure 6.9. If the crest is horizontal, the stage discharge equation is
Q = 3.5bh1.65 6.3
The constants will vary with the height of the weir above the streambed; they are greater than those for a flat crested weir because the cross section is more efficient in water flow. If the crest is in the shape of a flat V, the exponent in the discharge equation changes to 2.5 or more.
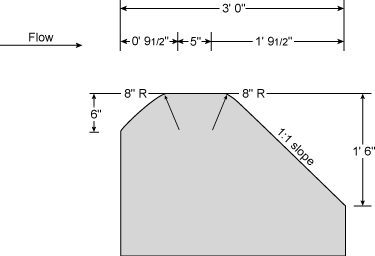 |
| Figure 6.9. Trenton type control in concrete broad crested weir. |
Columbus Type Control
Another common type of control in the United States is the Columbus type control. The control is also concrete but with a parabolic notch that gives more accurate measurement of a wide range of flows. The discharge equation is
Q = 38.5(h - 0.2)3.3 6.4
The equation assumes the head exceeds 0.7 feet, the elevation of the top of the notch. This implies the elevation of effective zero flow is 0.2 feet.
Submergence of Broad Crested Weirs
Similar to thin plate weirs, for a given static head, the discharge in broad crested weirs decreases as the submergence ratio increases. The threshold value of the submergence ratio, where the discharge is first impacted, ranges from 0.65 to 0.85, depending on the cross section shape of the weir crest.
Flumes
Flumes are commonly used in contractions in channel width where free fall or an increase in bed slope produce critical or supercritical flow in the flume. The stage measured at some cross section and discharge is only dependent upon the characteristics of the flume. Historically, one of the most common types of flumes was the Parshall flume, but it has generally been replaced with a variety of long-throated flumes. The most common supercritical flow flume is the trapezoidal flume. Flumes are commonly used in irrigation, flood, and water supply canals, but are rarely used for measuring discharge at gaging stations used for flood forecasting. The equations governing the relationship between stage and discharge in flumes will not be discussed further here, but the interested reader can refer to Bureau of Reclamation (1997) for a detailed discussion of flume hydraulics.
Natural Section Controls
Natural section controls consist of a rocky ledge outcrop across a channel, a riffle composed of loose rock, cobbles, and gravel or a gravel bar. Less common are a natural constriction of the width of a channel, or a sharp break in channel slope.
If the control is a rock outcrop, riffle, or gravel bar, the stage discharge relationship is simulated as a broad crested artificial control. If, for example, the natural control is essentially horizontal for the entire width of the control, the head on the control is the difference between the gage heights of the water surface and the crest.
The stage discharge relationship is again expressed by
Q = p(G - e)N 6.2
However, N, will be greater than 1.5 since the approach velocity increases with stage. If the crest has a roughly parabolic profile, the exponent will be even larger because of the increase in width of the stream with stage. The value of N will usually exceed 2.0. For irregular controls, the gage height of effective zero flow (e) for all but the lowest stages, will be greater than that for the lowest point in the notch.
Stable Channels
Stable channels is a relative term since all natural channels exhibit variation as a result of scour, deposition or the growth of vegetation. The discussion will be limited to all but sand channels.
Virtually all unregulated streams have channel control at the higher stages. Among those rivers with stable channels, all but the largest have section control at the lowest stages.
The stage discharge relationship for these channels is the Manning's discharge equation (in English units),
Q = (1.486AR2/3S1/2)/n 6.5
where again Q is the flow rate, A is the cross sectional area of flow, n is the roughness coefficient, R is the wetted perimeter, and S is the streambed slope. For any stage, all quantities on the right hand side of the equation are known except the roughness coefficient. A value of n can be determined from a single discharge measurement, or an average value of n can be computed from a pair of measurements. A preliminary rating curve can be computed for the entire range of stage. If subsequent discharge measurements depart from the rating curve, it is likely that the assumption of the flow at uniform depth was invalid. In this situation, the energy slope, S, is not parallel to the bed slope, but varies with stage and consequently the value of n, computed on the basis of the bed slope, is in error.
In a natural channel of irregular shape, the stage discharge relationship can again be developed via Manning's equation. However, the following assumptions are necessary:
- at higher stream stages, n is constant and the energy slope is constant
- the cross sectional area is approximately equal to the depth (D) multiplied by the width (W)
Replacing (1.486S1/2)/n with a constant C1, Manning's equation becomes,
Q = C1DWR2/3 6.6
Assuming the hydraulic radius, R, is equal to D, and W is constant, the equation simplifies to
Q = C(G - e)1.67 6.7
Unless the stream is exceptionally wide, R is much less than D. This has the effect of decreasing the exponent in the Manning equation; this reduction can be offset partially by increasing S or W with discharge. Changes in the roughness coefficient will also impact the exponent. The discharge equation can be expressed as
Q = C(G - e)N 6.8
The exponent, N, varies between 1.3 and 1.8.
Compound (Section and Channel) Controls
In natural channels, compound controls usually control the stage discharge relationship. Section control is effective for the lower stages and channel control, the higher stages. Section control is almost always characterized by an increasing second derivative of Q with respect to water depth H., while for channel control, the second derivative of Q with respect to water depth H is decreasing. This condition results in a linear (log plots) rating curves for section control almost always having a slope greater than 2.0 while the slope of the rating curve for channel controls have slope less than 2.0. A non rigorous proof of this relationship between the second derivative of discharge with water depth and rating curve slope can be developed by considering the general discharge equation, Q = CHN where N is again the slope of the line. The first derivative of the equation is
dQ/dH = CNHN-1 6.9
The second derivative can be expressed as,
d2Q/dH2 = CN(N-1)HN-2 6.10
The second derivative increases with stage provided N exceeds 2.0; it decreases with stage when N is less than 2.0. Figure 6.10 illustrates an actual compound control rating curve for the Susquehanna River, Harrisburg, PA.
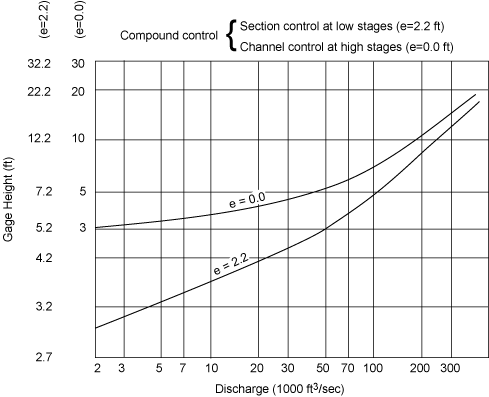 |
| Figure 6.10. Compound control rating curve for the Susquehanna River, Harrisburg, PA. |
Lesson 6 Summary
Continuous records of discharge at gaging stations are computed by applying a discharge rating to stage data. The discharge rating curve transforms the stage data to a continuous record of stream discharge, or transforms forecasted flow to stage. The discharge rating curve may be simple or complex depending on the factors or variables considered in the underlying stage discharge equation. This lesson examined simple stage discharge models for natural and artificial controls where the discharge is only a function of stage and to determine how these relationships can be extrapolated for other flow conditions.
The following terms and concepts were introduced in this lesson and should be mastered prior to continuing with on to Lesson 7. Selecting a link in the list below will result in a jump to the portion of the lesson material above that covered the relevant material so that it can be reviewed as necessary.
- Definitions
- Concepts
Lesson 6 Review Questions
- Which scale is best when viewing rating curves to assess moderate to high flow conditions?
- The development of rating curves is objective because analytical equations are used to develop the curves.
- The rate of increase in stage, for a given increase in flow, is Indirectly/Directly proportional to the steepness of the rating at the starting stage
Lesson 7 Preview
In practice, ratings curves are often extended or extrapolated beyond the range of discharge measurements. The extrapolation of the rating data can lead to considerable uncertainty in the prediction of discharge. Lesson 7 examines low flow and high flow extrapolation and methodologies to quantify possible shift in the stage discharge relationship.The discharge rating curve may be simple or complex depending on the factors or variables considered in the underlying stage discharge equation.

