

Stage Measurement---Introduction and Objective
Developing a stage-discharge relationship for a stream requires a set of observed stage (water depth) and discharge measurements. Stage is useful for flood plain studies and determining the impact areas in flood conditions. The reliability of discharge records and/or predictions is dependent on the accuracy of the stage data. Errors in the data can be expected to affect the stage-discharge relationship of the stream or river.
The objective of this Lesson is to examine the types of gages and devices that are used in the measurement and recording of water levels. The accuracy of the data and possible error sources are also described.
Stage Data
 |
| Figure 4.1. Nomenclature for gage datum. |
The development of discharge or streamflow data is based on stage data. Formally, stream stage is the elevation of the water surface above a datum. The water surface elevation relative to a predetermined datum is also called the "gage height". Although stage and gage height are used interchangeably, gage height is technically used to indicate a reading from a gage. The stage or gage height is usually expressed in units of feet with a reported precision of ± 0.01 feet. The nomenclature for a gage datum is illustrated in Figure 4.1.
Gage Datum
The gage datum can either be a recognized datum such as mean sea level, or an arbitrary datum plane. If low numbers are expected for gage height, an arbitrary datum plane is usually more convenient. For example, as in Figure 4.1, the datum is often set below the elevation of zero flow for a natural control, eliminating the possibility of negative values of gage height if scouring of the stream channel occurs in the future. In some cases, sufficient streambed scour occurs requiring a new datum to be established to avoid negative gage heights (Figure 4.2).For artificial controls, the datum is set at an elevation corresponding to zero flow.
 |
| Figure 4.2. Gage datum moved due to streambed scour. |
Typically, a permanent datum is maintained for the life of a stream gaging station. This requires at least two or more reference marks, or permanent points of known gage height elevation, independent of the gage structure. Periodically, the datum at each gaging station is checked by running levels from the reference marks to the gages at the station. Running levels is a surveying technique used to determine the elevation of a location based on the known elevation of a reference location.
For arbitrary datums, their elevations are also referred by levels to a bench mark of known elevation above mean sea level. This ensures that the arbitrary datum may be recovered if the gage and reference marks are lost.
Gaging Station Components
Introduction
A site on a river where stage data is systematically collected is called a gaging station. Each gaging station has at least one manually read instrument for measuring the river stage. They often have a significant amount of additional instrumentation such as automatic gages, additional manual gages for backup, data storage devices, and telemetry for transmitting data from a remote site. Gaging sites also involve infrastructure such as shelters to house the instruments. The purpose of this section is to describe the individual components of a gaging site. Subsequent sections will describe how the components are assembled for three different types of gaging sites.
Gages will frequently be referred to as recording or non-recording. A non-recording gage requires manual observation any time a stage measurement is needed. They might be thought of as manual gages. Recording gages automatically measure the stage and record the values. For gages that record the data electronically, transfer of the data is also possible using phone lines, or radio and satellite transmission.
 |
| Figure 4.3. Staff gage with attached crest gage. |
Staff Gage
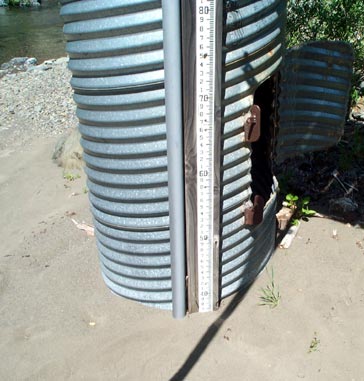
A common nonrecording gage is the staff gage (Figure 4.3). Staff gages are either inclined or vertical. The standard USGS vertical staff gage consists of porcelain-enameled iron sections. Each section is 4 in wide, 3.4 feet long, and graduated every 0.02 feet. The vertical staff gage is used inside and outside of stilling wells or in streams.
The inclined staff gage consists of graduated heavy timber that is attached to permanent foundation piers. These gages are built flush with the streambed; as a result, they are less likely to be damaged by flood events, or floating ice and other debris. They are used only as outside gages.
In some cases, a staff gage may be as simple as painted graduated numbers on a bridge foundation pier. As with the inclined staff gages, the permanent marks are placed such that the stage can be observed from a location accessible even during times of high flow.
Wire-Weight Gage
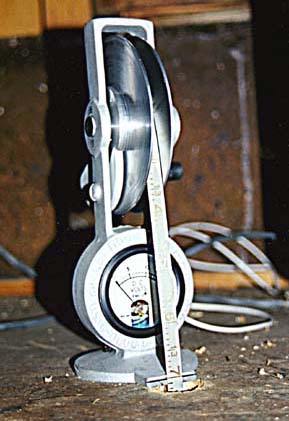
In the United States, the wire-weight gage is known as the Type A wire- weight gage (Figure 4.4). This nonrecording gage consists of a drum wound with a single layer of cable. A bronze weight is attached to the end of the cable. A graduated disc and a Veeder counter complete the gage which is housed within a cast aluminum box.
The graduated disc is scaled in tenths and hundredths of a foot. The diameter of the drum is such that each complete turn represents a 1 foot movement of the weight. A horizontal checking bar is located on the lower edge of the instrument. This is necessary to ensure that when it is moved to the forward position, the bottom of the weight will rest upon it.
The gage is located in a position such that when the bottom of the weight is at the water surface, the gage height is indicated by the combined readings of the counter and the graduated disc. The Type A gage is typically mounted, as an outside gage, on a bridge handrail, parapet wall, or pier.
 |
| Figure 4.4. Wire weight stage gage. |
 |
| Figure 4.5. Float tape stage gage. |
Float Tape Gage
A float tape is a nonrecording gage that consists of a pulley, counterweight, graduated steel tape, and a float (Figure 4.5). The float pulley is 6 inches in diameter. The float pulley is also grooved on the circumference to accommodate the tape. Normally, a 10 inch diameter cooper float and a 2 lb lead counterweight are used. The float type gage is used primarily in stilling wells.
Electric Tape Gage
Another nonrecording gage is the electric tape gage, which consists of a steel tape which is fastened to a cylindrical weight, a reel in a frame for the tape, a 4.5 volt battery, and a voltmeter (Figure 4.6). The steel tape is graduated in hundredths of a foot. One battery terminal is attached to a ground connection; the other to the voltmeter. The remaining terminal of the voltmeter is connected through the frame, reel, and tape to the weight. The weight is lowered until it contacts the water surface. The water contact completes the electric circuit and generates a signal on the voltmeter. The weight is held in the position of the first contact, the tape reading is observed at the index located on the reel mounting.
Chain Gage
A chain gage is typically used where an outside staff gage is difficult to maintain, or an installation is not available for a wire-weight gage. Figure 4.7 depicts a chain gage. The gage can be mounted on a cantilevered arm extending over the stream.
The chain gage consists of the cantilevered arm, and a series of one or more enameled gage sections. These gage sections are mounted horizontally on the cantilever. A heavy sash chain runs over the pulley on the streamward end of the cantilever. The chain is mounted on the cantilever so that it moves along the gage sections. A weight is attached at the streamward end of the chain; and an index marker is located near the other end at a distance from the weight that is appropriate for reading the gage height of low flows. It is possible to attach additional index markers at appropriate intervals to read gage heights greater that those directly obtainable from the mounted gage sections.
The stage is estimated by lowering the weight until the bottom of the weight touches the water surface. The gage height is then noted from the mounted gage plate and the location of the appropriate chain index marker.
 |
| Figure 4.6. Electric tape stage gage. |
 |
| Figure 4.7. Chain gage. |
Crest Gage
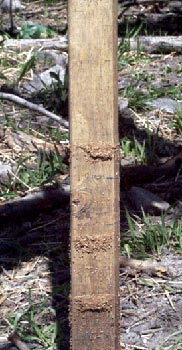 |
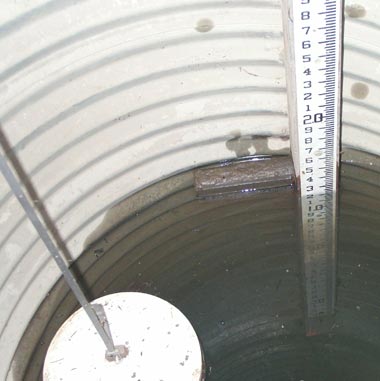
| Figure 4.8. Measuring stick from a crest gage with attached cork. |
A crest stage gage is an instrument for obtaining the elevation of the flood crest of streams. It is widely used because of its reliability, simplicity and low cost. The crest gage is a stick inside a pipe with a perforated bottom. The pipe also contains a small amount of ground cork which floats on the surface of the water as it rises in the pipe. As the water level recedes, some of the cork adheres to the stick at the highest water level reached inside the pipe (Figure 4.8). The water crest is determined by measuring the highest level of cork on the stick.
The crest gage is a valuable addition to any stage recording station, providing a backup measurement if the recording gage data is lost due to high water, gage damage, or power loss. A crest gage is visible next to the staff gage in Figure 4.3.
Float Sensor
A float sensor consists of a float in a stilling well attached to one end of a tape or cable, with a counterweight attached to the other end. The float follows the rise and fall of the water level. The water level in turn can be read using an index and graduated tape. The pulley can also be attached to a water stage analog or digital recorder. Float systems generally have an accuracy of 0.01 feet
Bubble Gage Sensor
In a bubble gage or gas purge system, a compressed gas, usually nitrogen, is fed through a tube and bubbled freely to the stream through an orifice at a fixed elevation in the stream. The resulting gas pressure in the tube is equal to the sum of the pressure and elevation heads on the bubble orifice at any gage height, and is transmitted to either a manometer or pressure transducer. Historically, the USGS have used mercury manometer to measure the gas pressure. These units have been largely replaced with solid state pressure transducers because of environmental and personal health concerns associated with mercury contamination. Some pressure transducers convert the gas pressure to mechanical movement which can then be connected to a mechanical recording device. Most current bubble gage systems use a solid state pressure transducer that provides a digital output signal that is transmitted to a digital recording or memory device. Bubble gage sensors generally have an accuracy of 0.01 feet
The most critical element for proper stage recording is the placement of the orifice. Ideally, it should be located where the weight of the water above it represents the stage of the stream. If the orifice is partially buried, the recording stage will exceed the true stage. It should also not be installed in swift currents; if necessary, the orifice should be located at right angles to the direction of flow. The orifice should also not be located in turbulent flow.
In some cases, the orifice is installed in a well point that is driven into the streambed. Satisfactory operation requires that the streambed material should not be so finely grained so as to impede the passage of river water to the well point, which can cause lag in the recorded stage. A stainless steel screen set 1 to 3 feet below the streambed is recommend.
Sealed Pressure Transducer
A sealed pressure transducer also measures the weight of the column of water, but does not release a gas to do so. Relatively small and reliable solid state sealed pressure transducers are now available that directly output a digital signal that is transmitted to a digital recording or memory device.
Stage Recorders
A stage recorder is a device for producing a graphical, digital, or punched tape record of the temporal variation in water surface elevation. The instrument consists of a gage height component and a time component. A float, manometer, or pressure transducer provides the gage height component. The time element is controlled by a clock or digital timer driven by electricity, spring, or a weight.
The stage records are either digital or graphical. Historically, both techniques were comparable in accuracy, reliability, and cost. Graphic recording methods were frequently used at sites where there are ice and backwater effects, or where there are frequent malfunction problems. Digital devices are directly compatible with computers and are now significantly cheaper and more reliable than graphical recorders. The digital automation of the gaging sites offers more economy and flexibility in the computation and dissemination of stage-discharge data.
The analog or graphic recorder depicts a continuous trace of water stage versus time. Typically the gage height element moves a pen or pencil stylus and the time element moves the chart (in some recorders these actions are reversed). The gage-height scale ranges from 1 to 20 feet. The variation in the time scales is from 0.3 to 9.6 inches per day.
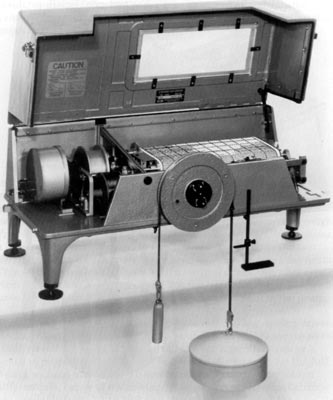
Graphic records are either strip chart records (Figure 4.9) or drum recorders (Figure 4.10). Strip chart recorder can operate for several months without requiring maintenance. Drum records usually require weekly maintenance.
 |
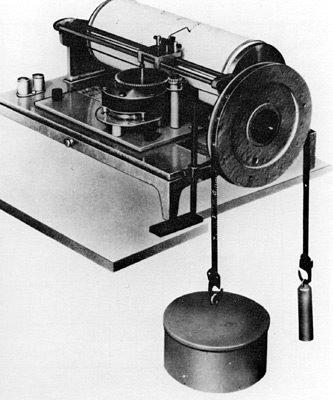 |
| Figure 4.9. Continuous strip chart stage recorder. | Figure 4.10. Continuous drum chart stage recorder. |
Digital recorders provide a stage measurement at fixed intervals of time. The time interval between recorded data varies with the type of recorder used. Digital records may miss the absolute peak stage in situations where a stream responds very quickly to precipitation. For float type stage instruments, a measure of the maximum peak can be obtained by attaching a small magnet to the float tape just below the instrument shelf. As described by Rantz et al. (1982), the magnet will slide along the tape as the stage rises but remain fixed as the stage declines.
The initial digital records of the U.S. Geological Survey were a battery-powered, slow speed paper tape punch. The unit recorded a 4 digit number on a 16 channel paper tape at preselected time intervals. Stage is recorded in increments of a hundredth of a foot; the range in data is from zero to 99.99 feet. The recording periods are hourly, every 30 minutes, and every 15 minutes. Figure 4.11 depicts a digital paper tape recorder.
Modern digital recorders (frequently called a data logger) can store thousands of data values, and can often transmit the data to central data collection and processing centers. These recorders are microprocessor controlled, use very little power, and can be programmed to use sample rates high enough to not miss a peak stage event. A modern digital data recorder is shown in Figure 4.12.
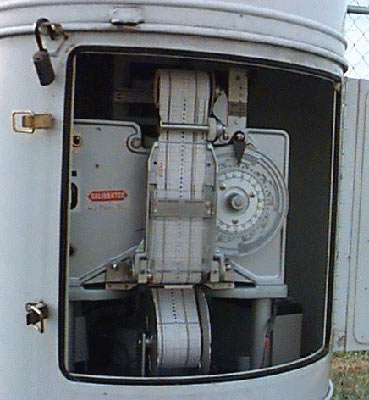 |
| Figure 4.11. Digital punchtape stage recorder. |
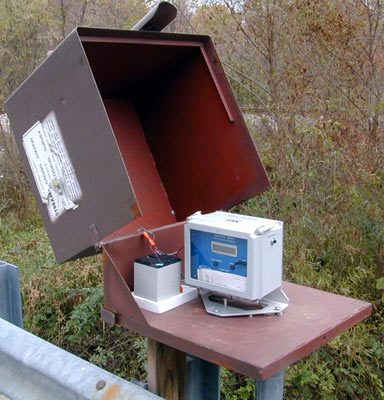 |
| Figure 4.12. Digital data logger used to store stage measurements. |
Telemetry Equipment
At many gaging stations, data is transmitted to a central data center via telemetry equipment at the station. Three different communication systems are used to transmit the data; telephone, satellite, and radio.
There are a number of devices which can be connected to data loggers which provide access to water level data via telephone. Most of these devices can be accessed via a computer or other audio means. One specific system used is called Limited Automatic Remote Collector (LARC) system. Battery powered devices are typically attached to water level and precipitation instruments. When queried via a phone line, the LARC powers up to collect, process, and then transmit hydrometerology data to the querying office. After this process is completed, the LARC powers down until called again.
In the GOES Data Collection Platform (DCP), a microprocessor-based system collects hydrometeorology data, including precipitation, air temperature, and water level from sensors. The DCP processes and stores the data in random access memory (RAM), and transmits the data upon request to the central data center via GOES satellites. The units are battery operated, and use solar panels for recharging which allows them to be located in remote areas.
The Automated Local Evaluation in Real-Time system (ALERT) relies on line-of-sight radio communications between the ALERT station and either a base station or a repeater. An ALERT station consists of equipment to gather hydrometeorology data, including precipitation, air temperature, and water level, communications devices to transmit the data, and computers to decode and display the data.
Complete Stage Gaging Stations
Stage gaging stations usually contain a number of the components described above. The stations can be categorized as simple manual, float gage, and pressure transducer based stations. The manual gaging station is a non-recording station. The float gage and pressure transducer based stations are recording stations where data values are automatically stored in some analog or digital manner.
Reference and Auxiliary Gages
Nonrecording gages are used as reference and auxiliary gages at stream gaging stations. A reference gage by definition is the gage to which the recording gage is set—it is the base gage for the recording station. An auxiliary or secondary gage serves as a backup for the reference gage. The auxiliary gage can be used as a cross-check on possible errors in the reference gage. While often lacking the accuracy of the reference gage, the auxiliary gage may be easier to read during periods of high water than the reference gage.
Occasionally, a reference mark or point of known elevation with respect to a gage datum is used in place of a reference gage. Stage is determined by measuring from the reference mark or a point down to the water surface either in the stilling well or the stream. While the practice is considered acceptable, it is viewed as not nearly as convenient of using a standard nonrecording gage. Note that a reference mark is a mark not located on the gage structure; it is unaffected by any movement of the gage structure.
Simple Manual Gaging Station
 |
| Figure 4.13. Staff and crest gages at a manual gage station. |
Simple manual nonrecording gages have several important advantages over recording gages, including ease of installation, low initial cost, and low operation and maintenance costs. The limiting factors of nonrecording gages are that they require an observer and often lack the accuracy of continuous recording stage. For long term operation, the advantages of recording gages outweigh nonrecording gages and the use of a manual gaging station is not recommended. However, nonrecording gages stations may be maintained as auxiliary gages for recording gage station operation. Data at nonrecording stations are usually read twice daily by an observer; additional reading are supplemented during times of rapid stage variation. Figure 4.13 shows a typical arrangement of staff and crest gages that could serve as a manual stage gaging station.
Float Gage Based Gaging Station Well
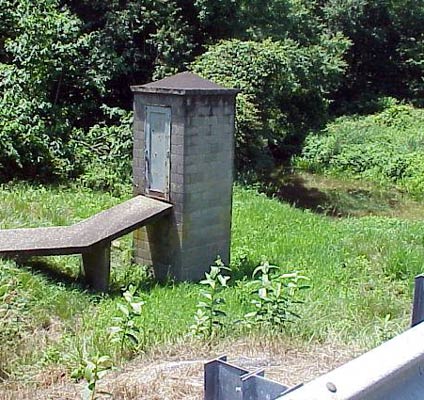
The actual measurement of stage for a float gage based gaging station takes place in a stilling well (Figure 4.14). A stilling well protects the measurement device and dampens the fluctuations in the stream's water surface caused, for example, by wind and turbulence. Stilling wells are constructed of concrete, reinforced concrete block, concrete pipe, steel pipe, and occasionally wood. They are typically placed directly in, or adjacent to the stream bed (Figure 4.15) or attached to abutments or bridge piers (Figure 4.16). Water from the stream enters and leaves these stilling well through an intake such that the water in the well is at the same elevation as the water in the stream.
 |
| Figure 4.14. Typical components of a stilling well based gage station. |
 |
 |
| Figure 4.15. Concrete block stilling well adjacent to stream. | Figure 4.16. Stilling well attached to bridge (Potomac River at Point of Rocks, MD). |
For stations equipped with a stilling well for float operated recorders, the possibility exists that the stilling well stage may not represent the true stream stage, e.g. intakes can become clogged. A nonrecording auxiliary gage can be installed outside the stilling well so that the water level of the stream can be compared with the stage in the stilling well (Figure 4.17). The auxiliary gage will indicate whether or not the recording gage is in error. If there are problems, the gage can be repaired and the auxiliary gage can be used as a temporary substitute for the recording gage. Staff and wire-weight gages off a nearby bridge are often used as auxiliary gages.
Nonrecording gages can also be used in structures equipped with stilling wells. The readings on the inside gage are again compared with the water surface elevation in the stilling well. The inside gage is the base or reference gage for the station (Figure 4.18). Float, electric tape gages, or vertical staff gages are the most common inside reference gages using in stilling wells.
 |
 |
| Figure 4.17. Stilling well outside auxiliary gage. | Figure 4.18. Stilling well float and inside reference gage. |
In the United States, the practice of using the inside gage, rather than the outside gage as the reference of base gage in stilling well sites is common practice. The conventional wisdom implies that the recorded (inside) gage heights are used to determine discharge. If differences exist between inside and outside stages, those differences are known only for those times when both gages are read. Conversely, if the outside gage is used as the reference gage, corrections both known and assumed are to be applied to all recorded gage heights to convert them to outside stages. Moreover, outside gages are often difficult to read accurately because of wind and wave action.
During flood events, outside high water marks are obtained for each event. Both inside and outside stages are published when the elevations of the marks differs significantly from the peak inside stage. When there is significant differences between the inside and outside gage readings, the stage-discharge relationship is first developed on the basis of the outside gage reading observed at the times when the discharge is measured. The data are then adjusted to correspond with the inside gage readings observed at the times associated with the discharge measurement.
Bubble Gage/Pressure Transducer Based Gaging Stations
 |
| Figure 4.19. Bubble gage or gas-purge gaging station components. |
Bubble gage or pressure transducer based gaging stations are very similar in arrangement to float gage based stations (Figure 4.19). The primary difference is that the stilling well is replaced with a shelter for gas storage (in the case of bubble gage) and the pressure transducer. The configuration of the sealed pressure transducer system is similar to that shown in Figure 4.19, but the gas cylinder is not used, and the orifice and orifice line is replaced with a submerged transducer and electrical cable to take the pressure signal to the recording equipment in the gage house.
For Bubble gage or pressure transducer based gaging stations, a nonrecording gage established in close proximity to the bubble orifice is a base or reference gage. It is used to check and reset the gage height indicated by the water stage recorder. Staff gages, bridge pier markings, and wire-weight gages off a nearby bridge are often used as reference and auxiliary gages. Crest gages will generally also be installed to prevent loss of data during periods of extreme flow or equipment malfunction.
Accuracy of the Stage Record
The errors in the recording of stream stage and the consequent impacts on discharge calculations are important considerations in river flow forecasting. We review possible sources of errors in this section that are generally not directly detectable from examination of the data and require field examination of the equipment at the gage site to identify, correct and/or repair. Significant errors that can be detected from the data in real-time are discussed in the next section.
Stage data are required to have an accuracy of ± 0.01 feet. Nonrecording gages provide a set of observations at discrete points of time. The interpolation of this data to obtain a continuous stage curve cannot attain this accuracy. However, with care, the individual gage observations can usually have an accuracy within ± 0.01 feet.
As discussed previously, the gage datum is required also to be maintained to the accuracy criterion of 0.01 feet. This is achieved by running levels to reference parks for the gage. These levels should be run at least once every 2-3 years. If a nonrecording gage is used as an outside auxiliary gage, a larger error is tolerated, e.g. 0.02 feet.
Staff Gage Errors
The uplift or settlement of the structures supporting the staff gage may alter the datum of the gage. When the datum has been disturbed, the inclined staff gage is recalibrated. For vertical staff gages, it is necessary to reset the individual sections.
Poor lighting conditions also impact the observations. Also, during surging or turbulent flow, stage is recorded as the mean of the elevations of the peak and trough of the water waves.
Wire-Weight Gage Errors
Datum of the gage may be effected by settlement of bridge abutments or piers, or the deflection of bridges. In addition to these possible datum changes, erroneous reading can also be caused by slippage of the graduated disc of the gage. The slippage results from insecure tightening of the disc screws.
Reliable observations are difficult to obtain when there is significant wave activity. As in the staff gage, under these conditions, the stage is the mean of the peak and trough of the waves. In contrast, it is also difficult to identify the water surface during quiescent water flow or on windy days, as the wire will bow in the wind. The error introduced depends on the wind intensity and the height of the gage above the water surface.
Another important source of error that increases with the height above the water surface is the tendency of the weight to rotate about its vertical axis. The rotation twists the wire; the sequences of twisting and untwisting shortens and lengthens the wire, biasing the stage data.
Float-Type Gage Errors
The principal sources of error inherent in float operated instruments are float lag, line shift, and submergence of the counterweight. Stevens (1921) quantifies the impact of these errors on stage measurement. Datum changes in a float-type gage can result from wholesale movement of the supporting structure or from slippage of the adjustable index. The gage will also read incorrectly if the tape slips in the clamp connecting the tape and float (overregister) or the float has a leak and takes in water (underregister).
Electric Tape Gage Errors
Datum changes can only occur if there is movement of support structure. This is because the position of the index of the gage is permanent with the instrument. An electric tape gage can be read incorrectly if the tape and weight are insecurely clamped together and slippage of the tape has occurred
Chain Gage Errors
In addition to structural movement, there are a variety of other error sources in chain gages. These include stretching of the chain, foreign material in the chain links, chain link wear, and wear of the pulley wheel. The reliability of stage readings is also affected by waves, wind, and water current in a similar manner for the other nonrecording gages.
Bubble Gage
Source of errors in the use of bubble gages for stage sensing include, as usual, datum corrections, sediment deposition on the bubble orifice, and leaks in the system. The principal error sources in a bubble gas records are variations in gas friction and required bubble feed rate with increasing state, and variation in the weight of the gas column with stage. The U.S. Geological Survey has conducted laboratory tests to assess these error sources. For additional information, reference the USGS memo at http://water.usgs.gov/admin/memo/SW/sw91.09.html.
Real Time Quality Control
A basic understanding of the equipment and procedures used for measuring stage, as provided in the previous sections, is useful for real-time quality control of stage and flow data. Many malfunctions of stage measurement equipment result in data anomalies that provide clues the problem. Understanding the functioning of the equipment provides insight into the nature of these clues and assists in their detection. Early detection of potential data errors is critical to ensure that data containing significant measurement or instrument errors are not used in flood forecasting computer models and not used for monitoring of hazardous river conditions. Understanding the source of the errors provides additional benefits besides detection.
There are instances when data from a malfunctioning gage can continue to be used for monitoring river conditions as long as the source of the error is understood and predictions are adjusted to account for the error. Furthermore, understanding the source of errors can assist in deciding if portions of data are not affected by the problem and therefore still valid. Finally, understanding the source of error can help the forecaster in notifying the agency responsible for the gage and in assessing how long erroneous data should be expected.
Bubbler — Pressure Tranducers
Because of environmental concerns regarding excavation of stream ecosystems, many conduits used for pressure transducers are anchored on top of the stream bank instead of being placed underground as was shown in Figure 4.19. These conduits can be dislodged during high flow by debris or moving rocks. As a result, the sensor elevation can be moved up or down, and usually downstream as well. Figure 4.20 shows a sensor that has been dislodged up 4 feet from its original position. The dislodged sensor will experience 4 feet less of water depth and therefore report a stage that is 4 feet too low. The hydrograph in Figure 4.21 has an unnatural "dog leg" feature at the time that the sensor was dislodged. It shows the drop in stage of 4 feet. The corresponding flow hydrograph would also have this signature. This feature in the data is a good indicator that a sensor has been dislodged and should be considered when using stream data for monitoring purposes, and when evaluating data for input into river models. Automatic data filtering on the computer data server can be configured to detect this behavior. The data filter would use a criteria based on a maximum rate of rise or fall in the stage measurements. If the rate of fall (or rise) is physically unrealistic, the filter can reject the data, or flag it for further human scrutiny.
 |
 |
| Figure 4.20. Dislodged pressure transducer. | Figure 4.21. Hydrograph resulting from dislodged (raised) pressure transducer. |
The data from a dislodged sensor can be used successfully if the difference is noted and the data appears to behave normally other than the known error. Future data from the sensor can be manually corrected to account for the error and can otherwise be considered valid data until the gage can be repaired.
A dislodged pressure transducer can only be properly repaired after the water has receded. There are ways, however, to circumvent the problem during high flows. The agency that maintains a particular gage may also be able to employ these solutions during a flood event. Many sites have multiple sensors because the site has a history of sensor damage or plugging by sediment movement. Sites can also have high flow and low flow sensors. The existence of multiple sensors is noted in most gage descriptions and suggests that the gage site can continue to be providing useful data during high flow by switching the gage to use an alternate sensor. A temporary sensor can also be deployed by attaching it to a block of concrete and launching it into the high flow. A new correction would then be noted using the reference gage as described earlier in the lesson.
A sensor can also be dislodged downward. This can occur if the sensor is a high flow sensor that is located far enough from the streambed to be bent downward without hitting the stream bed. The "dog leg" in the data will go the opposite direction compared to that which is depicted in Figure 4.20
 |
| Figure 4.22. Typical hydrograph from a plugged pressure transducer. |
Bubbler gages can have their orifice blocked by sediment that moves during high flow. This typically happens early in the flood season when summer sediment is first transported by high flow. The stage data produced by a blocked bubbler sensor can have an oscillating nature as shown in Figure 4.22. This results from the gas pressure building as a result of blockage until it can push through the blockage and purge itself. After purging, the pressure drops and the orifice becomes blocked again. The alternating nature of this process produces the oscillating stage data. Data demonstrating this characteristic is suspect and should not be used. Fortunately, bubbler gages are frequently equipped with a purge system whereby high pressure gas can be sent through the system to permanently purge the blockage. Also, this problem can be solved by switching to a backup bubbler sensor at sites equipped with multiple sensors.
Another source of oscillating stage data is from turbulence around the orifice of the bubbler gage. This can be caused by a log or rock shifted to a location near the orifice. The turbulent flow around such an obstruction causes alternating higher and lower pressure than would be present in laminar flow. The gage interprets these fluctuating pressures as changes in depth of water above the gage and therefore reports oscillating stage. Purging the system will not usually fix this problem. The only solution available during a high flow event is to switch to an alternate sensor, if available.
 |
| Figure 4.23. Typical hydrograph resulting from the stage exceeding the range of the pressure transducer. |
Pressure transducer sensors such as bubbler gages have water depth limits beyond which they do not function properly. If this limit is exceeded, the data will typically truncate until the water depth recedes to below the sensor limit (Figure 4.23). This type of problem corrects itself once the water level falls and therefore does not warrant calling the agency responsible for maintaining the gage. If the gage is critical, the period of lost data protracted, and the gage site is equipped with alternate, higher flow sensors, calling the maintaining agency is warranted.
Stilling Well
Intake lines can be plugged or partially plugged at sites that use a stilling well. Partially plugged intake lines will result in stage data that responds slowly to rainfall and also recedes slower than normal (Figure 4.24). The assessment that a stage hydrograph is responding abnormally must be based on familiarity of the stream's normal response and an examination of the rainfall intensity. When intake lines become completely blocked, the stage data will truncate and stay at a constant value as illustrated in Figure 4.25. Stilling well sites frequently have purge systems in place that can be used to clear a plugged intake line. This can be done while an event is occurring as long as access to the site is not blocked by high flow.
 |
 |
| Figure 4.24. Slow response hydrograph resulting from a partially plugged stilling well intake lines. | Figure 4.25. Truncated hydrograph resulting from a completely plugged stilling well intake lines. |
Truncated stage data can also be the result of a mechanical problem with the float or tape used to measure stage inside the well, and result from a high stage that exceeds the stilling well limit. While it can be difficult to identify the cause of truncated stage data at a stilling well, there are some useful guidelines. Completely plugged intake lines frequently become partially blocked first. This is indicated by a slow rising hydrograph that then becomes truncated. Mechanical problems, on the other hand, will likely produce an abrupt truncation of the data. Exceedance of the stilling well limit will also produce a very distinct truncation but it will only occur at very high flow and will go away when the stage recedes.
Lesson 4 Summary
Water level measurements are used both to develop a stage-discharge relationship and to provide a discharge estimate one the rating curve is available. The reliability of discharge records and/or predictions is dependent on the accuracy of the stage data. Errors in the data can be expected to affect the stage-discharge relationship of the stream or river. A wide variety of measurement and recording devices are used to provide water stage observations. Each of these methodologies has advantages, limitations, and associated error characteristics. An understanding of these features will enable the NWS hydrologist to evaluate the appropriateness and reliability of stage and the associated discharge data records.
The following terms and concepts were introduced in this lesson and should be mastered prior to continuing with on to Lesson 5. Selecting a link in the list below will result in a jump to the portion of the lesson material above that covered the relevant material so that it can be reviewed as necessary.
- Definitions
- Concepts
- selection of gage datum
- ideal placement of bubble gage orifice
- tradeoff between graphical and digital stage recorders
- use of reference and auxiliary gages
- categories of complete gaging stations
- types of stilling wells
- accuracy of stage measurement and recording devices controls
- real-time stage data quality control strategies
Lesson 4 Review Questions
- The gage height read from a staff gage located directly in a river indicates the depth of water in the river.
- During a flood event, the telemetered stage data from a forecast point, which uses a pressure transducer, indicates that the river stage is 23.5 feet while a spotter report, which is based on a manual reading of an outstaff (outside staff) gage, indicates that the stage is approximately 29 feet. Given no further information, which value would you assume is correct?
- Once a gage is known to be damaged and producing erroneous data, the data from the gage should not be used to monitor flooding.
- Observed stage data that is used in real-time during a flood event is not necessarily the same stage data used to develop rating curves.
Lesson 5 Preview
Developing a stage-discharge relationship for a stream also requires a set of observed flow (discharge) measurements. Lesson 5 provides an overview of the techniques and instruments used to measure stream discharge. The emphasis in Lesson 5 is current meter and tracer dilution techniques, and on the accuracy of the resulting discharge record.