Introduction
The crest of a thin plate weir is susceptible to damage from floating debris, so they are generally only used in small, clear-flowing streams. While thin plate weirs are rarely used for gaging flow at stations utilized in flood forcasting, they are an important measurement tool for measuring flow in many streams and canals. The relationship between stage and discharge for these weirs is presented here.
Thin Plate Weir
A thin plate weir has its crest, the surface over which the water flows, beveled to a chisel edge. Thin plate weirs are always installed with the beveled face on the downstream side. The stream bank must be high enough to accommodate the increase in stage caused by the installation of the weir. The most common weirs are rectangular, trapezoidal, and triangular or V notch.
The discharge of a weir is a function of
- the static head, h, which is the difference in the elevation between the weir crest and the water surface at the approach section. The approach section is located upstream from the weir a distance equal to 3h or more.
- the length of the crest of the weir, b, provided the weir is rectangular or trapezoidal
- the width of the channel in the plane of the weir's face, B
- the angle of side slopes for triangular or trapezoidal weirs
- the average depth of the streambed below the elevation of the weir crest, P (measured in the approach section.
Artificial Section Controls— Rectangular Thin Plate Weir
A typical rectangular thin plate weir is illustrated in Figure 1. The discharge can be expressed by the equation
Q = Cbh(3/2) 1
where Q is the discharge, C is a discharge coefficient, b is the length of the weir crest normal to the flow, and h is the static head relative to the weir crest.
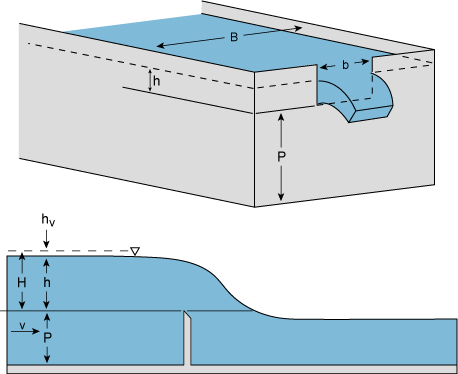 |
| Figure 1. Rectangular thin plate weir. |
The discharge coefficient is constant of proportionality, and is a function of dimensionless ratios dependent on the geometry of the channel and the weir,
C = (h/P, b/B, E) 2
where E is the slope of the weir face. The relation between C, h/P, and E for weirs with no side contraction (b/B = 1) are shown in Figure 2. Side contraction, which is the ratio of the width of the weir opening to the width of the stream, has the effect of reducing the effective length of the water crest. The value of C obtained from Figure 2 is multiplied by a contraction correction factor that is dependent on b/B, h/P, and the degree of rounding of the upstream vertical edge of the weir notch abutments. The correction factor kc) can be obtained from Figure 3.
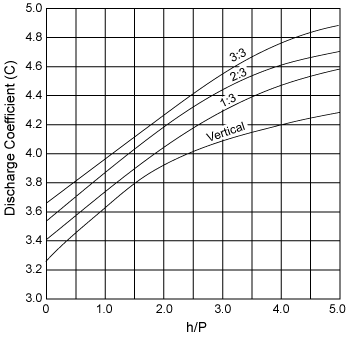 |
| Figure 2. Discharge coefficients for rectangular thin plate weirs at various weir face slopes (run:rise). |
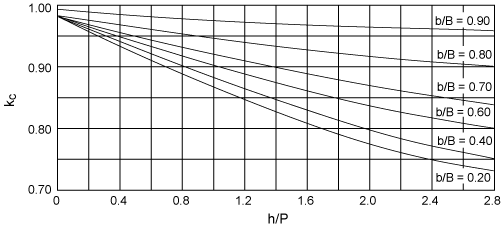 |
| Figure 3. Discharge coefficient correction factors for rectangular thin plate weirs. |
Rating Curve Rectangular Thin Plate Weir
The development of the rating curve for a rectangular thin plate weir is based on the discharge equation, Equation 1, and Figures 2 and 3. The data and calculations for a sample weir is shown in Table 1. The sample weir has dimensions P = 4 ft, B = 20 ft, b = 4 ft, and the gage height of the weir (e) = 15 ft. Note that this weir has a significant side contraction (b/B = 0.2), and the stage behind the weir may be significantly higher than the weir elevation.
| Table 1. Calculations for thin plate weir example problem. | |||||
| G (ft) | h (ft) | h/P | C | kc | Q=Ckcbh1.5 (cfs) |
| 15.0 | 0 | ||||
| 15.1 | 0.1 | 0.025 | 3.29 | 0.98 | 0.408 |
| 15.2 | 0.2 | 0.05 | 3.29 | 0.98 | 1.15 |
| 15.5 | 0.5 | 0.125 | 3.32 | 0.97 | 4.55 |
| 16.0 | 1.0 | 0.25 | 3.37 | 0.96 | 12.9 |
| 16.5 | 1.5 | 0.375 | 3.41 | 0.93 | 23.3 |
| 17.0 | 2.0 | 0.50 | 3.46 | 0.92 | 36.0 |
| 18.0 | 3.0 | 0.75 | 3.56 | 0.89 | 65.9 |
| 19.0 |
4.0 |
1.00 | 3.65 | 0.87 | 102 |
| 20.0 | 5.0 | 1.25 | 3.72 | 0.84 | 140 |
| 21.0 | 6.0 | 1.50 | 3.81 | 0.82 | 184 |
| 22.0 | 7.0 | 1.75 | 3.87 | 0.79 | 226 |
| 23.0 | 8.0 | 2.00 | 3.93 | 0.77 | 274 |
| 25.0 | 10 | 2.50 | 4.02 | 0.74 | 376 |
| 27.0 | 12 | 3.00 | 4.09 | 0.72 | 490 |
| 31.0 | 16 | 4.00 | 4.20 | 0.72 | 774 |
The logarithmic rating curve for the rectangular thin plate weir is shown in Figure 4. The Figure demonstrates that for heads greater than 6 feet (G = 21 feet), the log relationship between stage and discharge is approximately linear. The intercept, p, of the linear relationship at G - e = 1 feet is 10.8 ft3/sec; the slope of the line is 1.54. The discharge equation is then, Q = 10.8h1.54. As a check, for a gage height (G) of 25 feet, h = 10 feet, and Q = 10.8(10)1.54 = 374 ft3/sec, very close to the "true" computed value of 376 ft3/sec from Table 1.
The rectangular weir discharge equation, Equation 1, indicates that the product Ckcb is proportional to h1.5, therefore Ckcb = 11.4h0.04. Since b has a constant value of 4 feet, Ckc = 2.7h0.04.
 |
| Figure 4. Rating curve for rectangular thin plate weir example problem. |
Trapezoidal Thin Plate Weir
There are limited data defining the discharge coefficients of trapezoidal weirs (Figure 5). The exception is the vertical Cippoletti weir; the sides have a slope of approximately 1 in the horizontal or x direction to 4 in the vertical or y direction. The side slope is approximately what is required to obtain a discharge through the two triangular parts of the weir opening that equals the decrease in discharge resulting from the end contractions. The Cippoletti weir is effectively a rectangular thin plate weir whose crest is equal to b and with a contraction coefficient, kc = 1. The dimension, B, has little impact on the discharge. The discharge equation is again,
Q = Cbh1.5 3
Close approximations of C are obtain from Figure 5 with the head and the height of the notch are measured in the approach section.
 |
| Figure 5. Trapezoidal weir. |
For non Cippoletti weirs, the general empirical discharge equation can be expressed as
Q = Cb(h + hv)N 4
where hv is the velocity head at the approach section. The coefficient, C , and exponent, N, are determined from current meter discharge measurements that cover the entire range of stage conditions.
Assuming discharge measurements are not available for the highest available stage data, the rating curve is obtained by plotting on log paper the head (G - e) versus discharge, Q, for the observable data. A curve is then fit to the data points. The upper end of the curve should be a tangent or an extremely flat curve that can be extrapolated to the highest stage recorded. The limiting shapes of a trapezoid are a rectangle at one extreme and a triangle at the other. The slope of the tangent will therefore lie between 1.5, the theoretical slope for a rectangular weir, and 2.5, the theoretical slope for the triangular weir.
Rating Curve Trapezoidal Thin Plate Weir
The rating curve developed for a Cippoletti weir will be very similar to a rectangular weir. The only difference in discharge is the result of the value of kc is 1 for all values of head for the Cippoletti weir.
Triangular (V-Notch) Thin Plate Weir
Triangular or V-notch thin plate weir are used in low discharge streams (Figure 6). Since the area of notch is small in comparison with the cross sectional area of the channel, water is pooled upstream from the weir. As a result, the approach velocity is usually low and the velocity head can be neglected for 90° V notch weir (a = 90°). Moreover, if the ratio of h/p is less than 0.4 and h/B is less than 0.2, the approach velocity is negligible for values of a less than or equal to 90°}. Since little experimental work has been conducted for triangular weirs have significant approach velocities, we will presume a zero approach velocity. Also, it will be assumed that the weir's face are vertical.
The general discharge equation in English units can be expressed as
Q = 2.47h2.5 5
where h is the head and Q is again the discharge. The head is measured in the approach section at a distance approximately 3h from the face of the weir. Note that a logarithmic plot of Equation 5 yields a straight line. The slope of the rating curve is 2.5; the intercept with h = 1, will be 2.5tan(a/2). V notch weirs typically have central angle, a, of 90 degrees or 120 degrees.
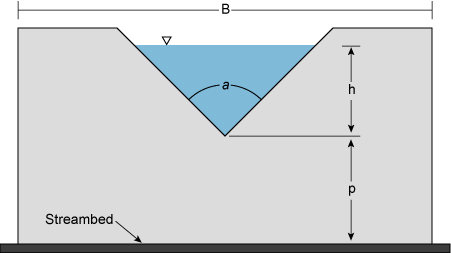 |
| Figure 6. Triangular or V notch weir. |
Submerged Thin Plate Weirs
The submergence of a thin plate weir occurs when the elevation of the downstream water surface exceeds the elevation of the crest of the weir. Submergence is illustrated in Figure 7. Submergence has the effect of reducing the discharge in comparison with free flow; the greater the ratio of ht/h, the submergence ratio, the greater is the reduction in discharge. As shown in Figure 8, the ratio of discharge for submergence conditions, Qs, to free flow discharge, Q, is plotted versus the submergence ratio raised to the power N, a parameter reflecting the type of weir. For example, N = 1.5 for a rectangular weir and 2.5 for a triangular weir.
 |
| Figure 6.7. Submerged thin plate weir. |
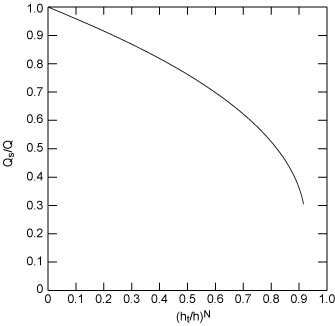 |
| Figure 6.8. Ratio discharged of submerged and free flow weirs. |

