

Background
The National Weather Service (NWS) provides weather, hydrologic, and climate forecasts and warnings for the protection of life and property, and the enhancement of the economy. NWS involvement in the Nation's water concerns includes long term water supply forecasts, drought monitoring, and river forecasting for all conditions including flooding.
U.S. Flood FactsAverage floods/year: 500 Flood related deaths: 95/year Flood related injuries: 193/year Property damage: $3.1 billion/year Further flood related impact data can be viewed here. |
Flooding is responsible for significant property damage and loss-of-life. Flood forecasts are produced by NWS River Forecast Center (RFC) hydrologists using rainfall-runoff models and hydraulic transport models. Their accuracy depends on the accuracy of the precipitation forecasts, the rainfall-runoff transformation, and the conversion of forecasted flow into stage. Weather Forecast Office (WFO) staff are responsible for disseminating the river forecasts in a form that is meaningful to the public through the use of statements which relate a forecasted stage to an actual impact such as the flooding of a particular road.
Hydrologists at River Forecast Centers and Weather Forecast Offices play critical roles in the hydrologic services program of the National Weather Service. While the contributions of the RFC and the WFO are different, hydrologists in both need to have a detailed understanding of hydrologic science as it applies to operational forecasting.
The Hydrologic Services Division of the National Weather Service Office of Climate, Water, And Weather Services (NWS/OCWWS) has recognized the need for service training opportunities for NWS staff in the area of basic hydrologic science. The intent of this training is to remedy the deficiencies of individuals with little or no formal education in hydrology, and to augment formal training in hydrology which focused on other problems such as hydrologic design or watershed management.
Objective
This web site presents an instructional training module that is a component of the NWS Professional Development Series (PDS) in Hydrologic Forecasting training program managed by the Cooperative Program for Operational Meteorology, Education, and Training (COMET). The training module will address Basic Stage-Discharge Relationships, one of the six topic areas identified by the COMET program and NWS/HSD as a critical training area for NWS hydrologists. The objective of this first lesson is to introduce the content and format of the training module, describe how to navigate the module web pages, and provide introductory comments about the use of stage-discharge relationships by NWS hydrologists.
Basic Stage-Discharge Relationship Module Lesson Format
This training module will consist of 10 goal oriented segments or lessons. The material included in each lesson will be selected so that it can be covered in a 35 to 45 minute lesson. Each lesson has one or two take-home messages. The lessons are designed to illustrate the hydrology topic in the context of the NWS hydrologist professional responsibilities. Each lesson begins with a brief review of previous lessons, a statement of learning objective for the current lesson, and an illustration of how this objective relates to common NWS hydrologist job responsibilities. The body of the lesson has short, self assessment questions at intermediate points to help the user determine whether continuing ahead is appropriate or whether the previous portion of the lesson needs to be reviewed. Numerous worked example problems are included where appropriate, as well as what-if situational questions incorporating concepts from the lesson. The lesson concludes with a restatement of the lesson objective, a summary of new material presented in the lesson, review questions, a list of reference material where appropriate, and a brief statement on what is contained in the next lesson.
Basic Stage-Discharge Relationship Module Contents
The 10 lessons in this instructional module will cover the following topics
- Introduction (this lesson)
- Fluid mechanics overview
- Selection of gauging station
- Stage measurement
- Flow measurement
- Simple stage-discharge relationships
- Limitations and uncertainty of stage-discharge relationships
- Complex stage-discharge relationships
- Stage-discharge relationships for tidal streams
- Practical high flow extension of rating curves
Navigating Module Web Pages
Each web page within this instruction module has a drop-down navigational menu that allows the user to jump directly to any lesson (or section of a lesson). In addition to selecting a specific lesson in the training module, the menu allows access to supplemental information including a bibliography and glossary. To activate the menu, just pass the mouse pointer over the Menu button. The location of the Menu button is illustrated in Figure 1.1 below. Each web page also contains the title of the lesson and a "home" button that will return the user to this introductory page. The training module was designed to be viewed using a modern browser such as Netscape 6.x (or above), or Internet Explorer 5.x (or above). Netscape Navigator 4.x is an ancient, non-standards compliant browser, that will do a very poor job of displaying some of the lessons.
 |
| Figure 1.1. Navigational controls for instructional module web pages. |
Stream Gaging and Flood Forecasting
Issuing river flow forecasts and flood warnings is one of the many responsibilities of the NWS. U.S. Code title 15, chapter 9, section 313 mandates that the NWS
"... shall have charge of the forecasting of weather, the issue of storm warnings, the display of weather and flood signals for the benefit of agriculture, commerce, and navigation ..."
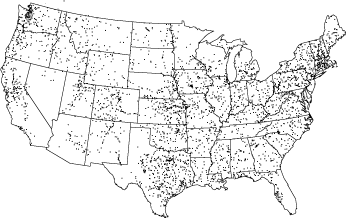 |
| Figure 1.2. Location of USGS gaging stations used by the NWS to develop river flow and stage forecast. |
The river flow forecasts provide both a flow rate and river stage. River flow rate or discharge is a measurement of the flow volume per unit time, generally reported in cubic feet per second (cfs or ft3/sec), or cubic meters per second (cms or m3/sec). River stage is the water surface elevation above an arbitrary datum, generally measured in feet (ft) or meters (m). Stage and discharge measurements are taken at a defined crossection, which a line perpendicular to the direction of flow. In addition to meteorological data, current and recent past values of discharge and stage are used develop the river flow forecasts. The majority of the river discharge and stage data is provided by the US Geological Service (USGS) from approximately 4,000 monitoring stations nationwide. The locations of the monitoring stations are shown in Figure 1.2.
Rating or Stage-Discharge Curve
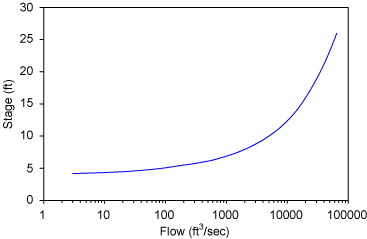 |
| Figure 1.3. Rating curve for Mad River near Arcata, CA. |
The measurement actually made at the USGS gage sites is river stage, which can be continuously and accurately measured within at least 0.1 inch. Because it is nearly impossible to continuously measure discharge at most locations, real-time river flow data is estimated by the USGS using a rating, or stage-discharge curve. A rating curve is a derived relationship between river stage and discharge. The rating curve is derived from measured values of discharge at a range of river stages. Developing a rating curve for a monitoring site is a time and labor intensive process. A sample rating curve for the Mad River near Arcata, CA is shown Figure 1.3, and the procedure for deriving a rating curve is described in Lesson 5.
Distribution and Use of Rating Curves in NWS Offices
Rating curves for natural streams are continually being updated because the discharge stage relationship changes as the streambed changes from natural scour and deposition. The dynamic nature of rating curves require that procedures exist to ensure that NWS hydrologists have access to the latest rating. As an example of how this can be accomplished, the California Nevada River Forecast Center (CNRFC) pulls the updated rating curves from the USGS website on a daily basis. This process is automated and ensures that the RFC forecasting software uses the correct, current rating when transforming forecasted flow into forecasted stage. The CNRFC also manually sends updated rating curves to the WFOs that it services once every week.
Rating Curve Limitations
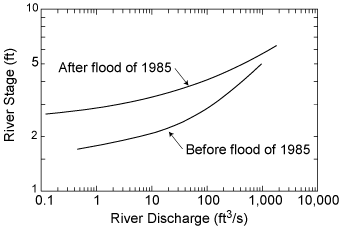 |
| Figure 1.4. Stage-discharge curve for the North River near Stokesville, VA., before and after the flood of 1985. |
A through understanding of the stage-discharge relationship for a river provides a useful means of providing flow estimates given easy-to-obtain stage measurements, and flow level estimates given discharge predictions. However, use of stage-discharge rating curves is not without significant potential limitations. As described further in Lesson 6, considerable uncertainty may be associated with the rating curve for a particular flow regime or river channel condition. For example, many channel crossections change considerable throughout the year, especially after a significant runoff event. Any change in the channel crossection can have a significant effect on the relationship between stage and discharge. The rating curve for the North River near Stokesville, VA before and after the flood of 1985 shown in Figure 1.4 illustrates how significant the change in the rating curve can be after a single flood event. For example, a discharge flow of 100 ft3/sec would result in a stage of 2.03 feet before the storm, and 2.68 feet after the storm, a 32% increase in river stage for this particular flowrate.
|
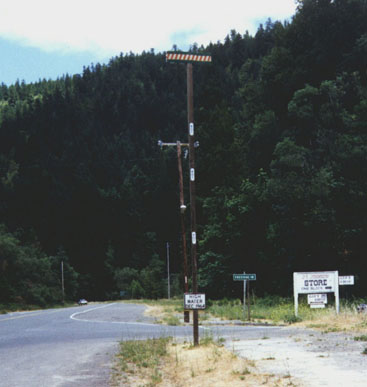
| Figure 1.5. High water mark (at the top of the pole!) from the December 1964 Eel River flood near Weott, CA. |
Considerable uncertainty in the rating curve may also result from insufficient or unreliable input measurement or conditions. A recent significant example of this problem was the April 1997 flood along the Red River of the North. At East Grand Forks, MN, the river crested at 54.11 feet on April 22, over 5 feet higher than predicted by the NWS up to April 14. While there was no loss of life, the resulting flood was responsible for approximately $4 billion of property damage. Subsequent investigation by a NWS Survey Assessment Team concluded that the flood stage prediction contained uncertainty due to the required extension or extrapolation of the rating curve to cover a flow value in excess of any previously recorded flow-stage paired observation. The Assessment Team also concluded that the hydraulic model relating flow and stage did not adequately consider the effect of several bridges crossing the river, and the effect of backwater downstream from the cities of Grand Forks and East Grand Forks. Another example of just how much extrapolation from previous observed high flow and stage values can be required is shown in the photo of the high water mark form the December 1964 Eel River flood near Weott, CA (Figure 1.5). The highest measured data point on the rating curve is 21 feet (52,000 cfs), while the 1964 flood stage was 46 feet with an estimated flow of 199,000 cfs.
Lesson 1 Summary
This web site presents an instructional training module on basic stage-discharge relationships, that is a component of the NWS PDS in Hydrologic Forecasting training program. The objective of this first lesson is to introduce the content and format of the training module, describe how to navigate the module web pages, and provide introductory definitions and comments about the use of stage-discharge relationships by NWS hydrologist. The following terms and concepts were introduced in this lesson and should be mastered prior to continuing with on to Lesson 2. Selecting a link in the list below will result in a jump to the portion of the lesson material above that covered the relevant material so that it can be reviewed as necessary.
- Definitions
- Concepts
- NWS is responsible for flood forecasting
- stage, discharge, and rating curves are generally provided by the USGS
- method of distribution of rating curves to NWS flood forecasting centers and field offices varies from region to region
- limitations of rating curves include changes in crossection following storms and extrapolation errors
All web pages within this training module have a common "drop-down" navigational menu system. Any of the lessons and the supplementary material can be directly accessed from the menu. While the menu system allows the lessons to be viewed in any order, the material is designed to be covered from Lesson 1 through Lesson 10 in order.
Lesson 1 Review Questions
- For each forecast point, the largest flood on record is a useful upper limit for forecasters to reference when developing forecasting procedures and techniques for that particular point.
- Rating curves for natural streams require very little maintenance once they are developed.
Lesson 2 Preview
A familarization with basic fluid mechanics is required to understand the science behind much of the material presented in subsequent lessons. In Lesson 2, basic principals of fluid mechanics related to stage-discharge relationships are presented.